|
|
A & B Components |
|
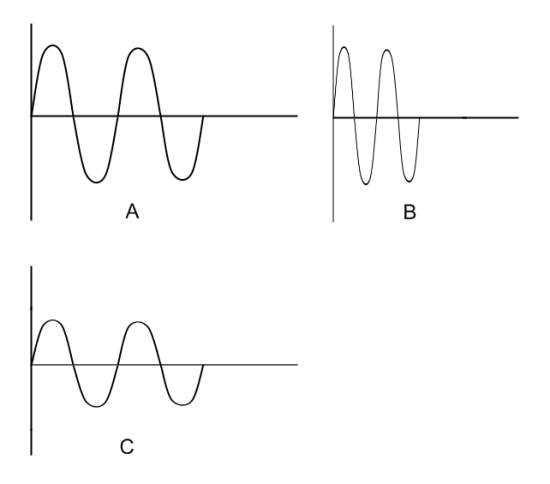
| The graphs show the sound which sensed by human ears. Frequency is the pitch of the voice, the higher the voice frequency is, the high-pitched sound we sense. The frequency of graph B is twice as much as graph A, which means B vibrates double within the same time. However the amplitude decides the volume of sound, graph C shows the smaller wave than A, so we will sense lower volume of sound in C.
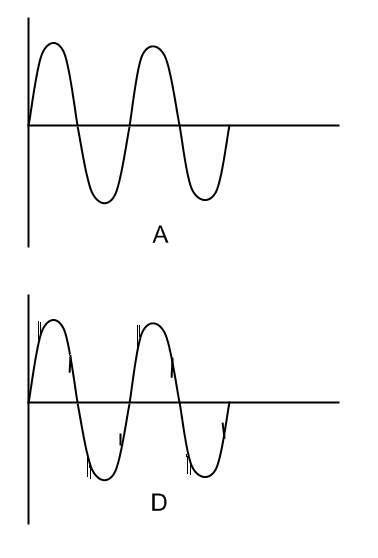
The shape of the sound wave affects the tone. For example, graph A and D have same frequency and amplitude, but there are a few more signals in graph D, the shapes are different. Therefore, we will sense the sound with same volume and pitch but different tone. We can put in another way, let’s take musical instruments for instance, maybe there are a few kinds of musical instruments can generate 1KHz sound, but we can easily distinguish which sound comes from which musical instrument, this is because every musical instrument, even every person has its own unique voiceprint.
A & B Components (Taiwan) - Your Acoustic Solution! Mail us now!!
|